
Questions about our company
How can I find out about your upcoming workshops?
Please contact Jaime or Shaun at 707-829-5551 to be added to our mailing list for upcoming training and events.
When was Biomarker Technologies, Inc. created?
Biomarker Technologies, Inc. has been in business since 1993 when it was founded as Biomarker Technology by CEO/President Dr. J.M. (Mike) Moldowan.
In 2012, Biomarker Technology was incorporated into Biomarker Technologies, Inc. and moved into a new, state-of the-art 7600 square foot laboratory in Rohnert Park CA. This laboratory was custom designed and built to meet or exceed the needs for hosting an environment of absolute analytical precision and current technology.
Where are you located?
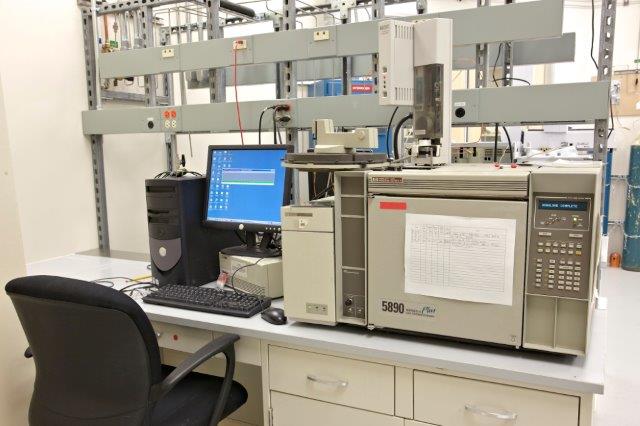
Biomarker Technologies, Inc. now encompasses a 7600 square foot laboratory (with office space) in Rohnert Park, CA and utilizes an in-house Agilent Technologies TQ-System and an Agilent Technologies MSD for unparalleled performance in analyses results and precision.
Our address is:
Biomarker Technologies, Inc.
638 Martin Avenue
Rohnert Park, CA 94928
What type of analyses do you perform in your laboratory?
Biomarker Technologies, Inc. performs the most delicate analyses, including advanced methods critical for understanding the complete petroleum system for basin modeling applied to exploration, development and production. Our advanced and proprietary analyses allow the customer to:
- Correlate any hydrocarbon sample: condensate, severely-biodegraded oil, seepage oil, source rock, and black oil.
- Discover and identify deep sources for gas and condensate in mature basins.
- Designate crude oil mixtures, then unravel and identify the components.
- Estimate the liquids component of tight shale before fracking.
- Determine multiple biodegradation sequences to improve heavy oil production, and model oil-charging history, along with estimating volumetric losses due to biodegradation.
- Understand the role of asphaltenes in heavy oil and unlock the secrets of oil provenance they have protected and preserved through the bio-alteration process.
Biomarker Technologies, Inc. offers the following types of analyses for exploration, development and production:
- All classical and client-specific GC-MS and GC-MS-MS analyses (Proprietary).
- Quantitative Diamondoid-Biomarker Analysis Method (QDA) (Proprietary).
- Compound Specific Isotope Analysis of the Diamondoids (CSIA-D) (Proprietary).
- Quantitative Extended Diamondoid Analysis (QEDA) (Proprietary).
- Compound Specific Isotope Analysis of Light Hydrocarbons (CSIA-LH).
- Compound Specific Isotope Analysis of Biomarkers and Alkanes (CSIA-B/A) (Proprietary).
- Age-related Taxon-specific Biomarkers (Specialty Program).
- Biomarker Acids Analysis (BAA) (Proprietary).
- Thiadiamondoid Analysis (Proprietary).
- Special C30 Sterane Analysis (SPC30SA) (Proprietary).
- Aromatics SIM-GC-MS (quantitative triaromatic steroids) (Proprietary).
- Gas chromatography.
- Source rock analyses.
- Hydrous pyrolysis.
- Asphaltenes component analysis for heavy oils (Proprietary).
- High Temperature simulated distillation (HT-SimDis).
What do you specialize in?
Biomarker Technologies, Inc. specializes in developing and applying those advanced geochemical methodologies directly applicable to oil and gas exploration and reserves development. Development of new exploration plays, reducing production costs, and maximizing yields require the application of new innovative technologies. This is true for all disciplines associated with the oil and gas industry including engineering, geology, geophysics and geochemistry. Ignoring the available innovative technology leads to stagnation and inadequate replacement of depleted reserves underscored by increased production costs.
Biomarker Technologies, Inc. also offers:
- Consulting Services;
- Workshops;
- Short Courses;
- Training;
- Interpretation;
- Project Design;
- Research and Development; and
- Internships.
Who is the owner of Biomarker Technologies, Inc.?
J.M. (Mike) Moldowan began his career with Chevron Upstream Research Company in 1974, working first with the late Dr. Wolfgang Seifert, and then leading the “Biomarker Section” until 1993. From 1993 until 2012, he was Professor (Research) in the Department of Geological & Environmental Sciences of Stanford University. Now as a Professor (Emeritus), close ties remain with the Stanford program in Basin and Petroleum Systems Modeling.
Mike has served as Chair of the Division of Geochemistry of the American Chemical Society, and he has twice been awarded the Organic Geochemistry Division of the Geochemical Society Best Paper Award for publications he co-authored in 1978 and 1989. His resume includes more than 100 formal publications on biomarkers and geochemistry and co-authorship of the “go-to” books on biomarkers, “The Biomarker Guide, 2nd Edition”, published by Cambridge University Press in 2005. In 2011 he received the Treib’s Medal for career achievements in organic geochemistry and became a Geochemical Fellow of the Geochemical Society and the European Association of Geochemistry. Biomarker Technology was formed in 1993 to further the exploration, and development of the petroleum industry through direct consultation based upon sample analyses performed by Biomarker Technology.
Click here to see Mike Moldwan bio.
What is Biomarker Acids Analysis?
Biomarker Acids Analysis (BAA) is the study of biomarker acids which is particularly relevant to exploration and production of heavy oil fields. BAA provides the only means to unravel and quantify the episodes of reservoir charging and oil entrapment, and reveal the details of the process by which oil becomes heavy (biodegradation) for each individual reservoir. By knowing this biodegradation and charging history, petroleum engineers and geologists will be able to better project oil quality to refine zone selection and co-mingling of oil to achieve the best results, delivering more product for less cost.
What is Gas Chromatography (GC)?
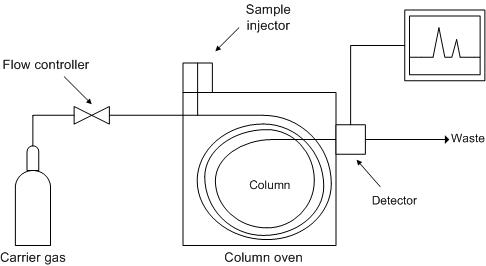
Gas Chromatography (GC) is a common type of chromatography used in analytical chemistry for separating and analyzing compounds that can be vaporized without decomposition. Typical uses of GC include testing the purity of a particular substance or separating the different components of a mixture (the relative amounts of such components can also be determined). In some situations, GC may help in identifying a compound. In preparative chromatography, GC can be used to prepare pure compounds from a mixture. In GC, the mobile phase (or "moving phase") is a carrier gas, usually an inert gas such as helium, or an unreactive gas such as nitrogen. The stationary phase is a microscopic layer of liquid or polymer on an inert solid support, inside pf a piece of glass or metal tubing called a column (a homage to the fractionating column used in distillation). The instrument used to perform GC is called a gas chromatograph (or "aerograph," "gas separator").
The gaseous compounds being analyzed interact with the walls of the column, which is coated with a stationary phase. This causes each compound to elute at a different time, known as the retention time of the compound. The comparison of retention times is what gives GC its analytical usefulness.
GC is, in principle, similar to column chromatography (as well as other forms of chromatography, such as HPLC and TLC), but has several notable differences. Firstly, the process of separating the compounds in a mixture is carried out between a liquid stationary phase and a gas mobile phase, whereas in column chromatography the stationary phase is a solid and the mobile phase is a liquid. (Hence the full name of the procedure is "Gas–liquid chromatography," referring to the mobile and stationary phases, respectively.) Secondly, the column through which the gas phase passes is located in an oven where the temperature of the gas can be controlled, whereas column chromatography (typically) has no such temperature control. Thirdly, the concentration of a compound in the gas phase is solely a function of the vapor pressure of the gas.
GC is also similar to fractional distillation, since both processes separate the components of a mixture primarily based on boiling point (or vapor pressure) differences. However, fractional distillation is typically used to separate components of a mixture on a large scale, whereas GC can be used on a much smaller scale (e.g., microscale).
GC is also sometimes known as vapor-phase chromatography (VPC), or gas–liquid partition chromatography (GLPC). These alternative names, as well as their respective abbreviations, are frequently used in scientific literature. Strictly speaking, GLPC is the most correct terminology, and is thus preferred by many authors.
What is GC Analysis?
A gas chromatograph is a chemical analysis instrument for separating chemicals in a complex sample. A gas chromatograph uses a flow-through narrow tube known as the column, through which different chemical constituents of a sample pass in a gas stream (carrier gas, mobile phase) at different rates depending on their various chemical and physical properties and their interaction with a specific column filling called the stationary phase. As the chemicals exit the end of the column, they are detected and identified electronically. The function of the stationary phase in the column is to separate different components, causing each one to exit the column at a different time (retention time). Other parameters that can be used to alter the order or time of retention are the carrier gas flow rate, column length and the temperature.
In a GC analysis, a known volume of gaseous or liquid analyte is injected into the "entrance" (head) of the column, usually using a microsyringe (or, solid phase microextraction fibers, or a gas source switching system). As the carrier gas sweeps the analyte molecules through the column, this motion is inhibited by the adsorption of the analyte molecules either onto the column walls or onto packing materials in the column. The rate at which the molecules progress along the column depends on the strength of adsorption, which in turn depends on the type of molecule and on the stationary phase materials. Since each type of molecule has a different rate of progression, the various components of the analyte mixture are separated as they progress along the column and reach the end of the column at different times (retention time). A detector is used to monitor the outlet stream from the column; thus, the time at which each component reaches the outlet and the amount of that component can be determined. Generally, substances are identified (qualitatively) by the order in which they emerge (elute) from the column and by the retention time of the analyte in the column.
Autosamplers: The autosampler provides the means to introduce a sample automatically into the inlets. Manual insertion of the sample is possible but is no longer common. Automatic insertion provides better reproducibility and time-optimization.
Different kinds of autosamplers exist. Autosamplers can be classified in relation to sample capacity (auto-injectors vs. autosamplers, where auto-injectors can work a small number of samples), to robotic technologies (XYZ robot vs. rotating robot – the most common), or to analysis:
- Liquid
- Static head-space by syringe technology
- Dynamic head-space by transfer-line technology
- Solid phase microextraction (SPME)
Traditionally autosampler manufacturers are different from GC manufacturers and currently no GC manufacturer offers a complete range of autosamplers. Historically, the countries most active in autosampler technology development are the United States, Italy, Switzerland, and the United Kingdom.
What are Inlets?
The column inlet (or injector) provides the means to introduce a sample into a continuous flow of carrier gas. The inlet is a piece of hardware attached to the column head.
Common inlet types are:
- S/SL (split/split-less) injector: A sample is introduced into a heated small chamber via a syringe through a septum – the heat facilitates volatilization of the sample and sample matrix. The carrier gas then either sweeps the entirety (split-less mode) or a portion (split mode) of the sample into the column. In split mode, a part of the sample/carrier gas mixture in the injection chamber is exhausted through the split vent. Split injection is preferred when working with samples with high analyte concentrations (>0.1%), whereas split-less injection is best suited for trace analysis with low amounts of analytes (<0.01%). In split-less mode the split valve opens after a pre-set amount of time to purge heavier elements that would otherwise contaminate the system. This pre-set (split-less) time should be optimized, the shorter time (e.g., 0.2 min) ensures less tailing but loss in response, the longer time (2 min) increases tailing but also signal.
- On-column inlet: The sample is here introduced directly into the column in its entirety without heat. The low temperature condenses sample into a narrow zone. The column can be heated, releasing the sample into gas phase. This ensures the lowest possible temperature for chromatography and keeps samples from decomposing above their boiling point.
- PTV injector: Temperature-programmed sample introduction was first described by Vogt in 1979. Originally Vogt developed the technique as a method for the introduction of large sample volumes (up to 250 µL) in capillary GC. Vogt introduced the sample into the liner at a controlled injection rate. The temperature of the liner was chosen slightly below the boiling point of the solvent. The low-boiling solvent was continuously evaporated and vented through the split line. Based on this technique, Vogt developed the programmed temperature vaporizing injector, PTV. By introducing the sample at a low initial liner temperature, many of the disadvantages of the classic hot injection techniques could be circumvented.
- Gas source inlet or gas switching valve: Gaseous samples in collection bottles are connected to what is most commonly a six-port switching valve. The carrier gas flow is not interrupted while a sample can be expanded into a previously-evacuated sample loop. Upon switching, the contents of the sample loop are inserted into the carrier gas stream.
- P/T (Purge-and-Trap) system: An inert gas is bubbled through an aqueous sample causing insoluble volatile chemicals to be purged from the matrix. The volatiles are 'trapped' on an absorbent column (known as a trap or concentrator) at ambient temperature. The trap is then heated and the volatiles are directed into the carrier gas stream. Samples requiring pre-concentration or purification can be introduced via such a system, usually hooked up to the S/SL port. (**Referenced on www.wikipedia.org )
The choice of carrier gas (mobile phase) is important. Hydrogen has a range of flow rates that is comparable to helium in efficiency. However, helium may be more efficient and provide the best separation if flow rates are optimized. Helium is non-flammable and works with a greater number of detectors and older instruments. Therefore, helium is the most common carrier gas used. However, the price of helium has gone up considerably over recent years, causing an increasing number of chromatographers to switch to hydrogen gas. Historical use, rather than rational consideration, may contribute to the continued preferential use of helium.
What are Detectors?
The most commonly-used detectors are the flame ionization detector (FID) and the thermal conductivity detector (TCD). Both are sensitive to a wide range of components, and both work over a wide range of concentrations. While TCDs are essentially universal and can be used to detect any component other than the carrier gas (as long as their thermal conductivities are different from that of the carrier gas, at detector temperature), FIDs are sensitive primarily to hydrocarbons, and are more sensitive to them than TCD. However, a FID cannot detect water. Both detectors are also quite robust. Since TCD is non-destructive, it can be operated in-series before a FID (destructive), thus providing complementary detection of the same analytes.
Other detectors are sensitive only to specific types of substances. Or, they work well only in narrower ranges of concentrations. They include:
- Thermal Conductivity detector (TCD), this common detector relies on the thermal conductivity of matter passing around a tungsten-rhenium filament with a current traveling through it. In this set up helium or nitrogen serve as the carrier gas because of their relatively high thermal conductivity which keep the filament cool and maintain uniform resistivity and electrical efficiency of the filament. However, when analyte molecules elute from the column, mixed with carrier gas, the thermal conductivity decreases and this causes a detector response. The response is due to the decreased thermal conductivity causing an increase in filament temperature and resistivity resulting in fluctuations in voltage. Detector sensitivity is proportional to filament current while it's inversely proportional to the immediate environmental temperature of that detector as well as flow rate of the carrier gas.
- Flame Ionization detector (FID), in this common detector electrodes are placed adjacent to a flame fueled by hydrogen / air near the exit of the column, and when carbon containing compounds exit the column they are pyrolyzed by the flame. This detector works only for organic / hydrocarbon containing compounds due to the ability of the carbons to form cations and electrons upon pyrolysis which generates a current between the electrodes. The increase in current is translated and appears as a peak in a chromatogram. FIDs have low detection limits (a few pictograms per second, but they are unable to generate ions from carbonyl containing carbons. FID compatible carrier gasses include nitrogen, helium, and argon.
- Catalytic combustion detector (CCD), which measures combustible hydrocarbons and hydrogen.
- Discharge ionization detector (DID), which uses a high-voltage electric discharge to produce ions.
- Dry electrolytic conductivity detector (DELCD), which uses an air phase and high temperature (v. Coulsen) to measure chlorinated compounds.
- Electron capture detector (ECD), which uses a radioactive beta particle (electron) source to measure the degree of electron capture. ECD are used for the detection of molecules containing electronegative / withdrawing elements and functional groups like halogens, carbonyl, nitriles, nitro groups, and organometalics. In this type of detector either nitrogen or 5% methane in argon is used as the mobile phase carrier gas. The carrier gas passes between two electrodes placed at the end of the column, and adjacent to the anode (negative electrode) resides a radioactive foil such as 63Ni. The radioactive foil emits a beta particle (electron) which collides with and ionizes the carrier gas to generate more ions resulting in a current. When analyte molecules with electronegative / withdrawing elements or functional groups electrons are captured which results in a decrease in current generating a detector response. (**Referenced on www.wikipedia.org.)
- Flame photometric detector (FPD), which uses a photomultiplier tube to detect spectral lines of the compounds as they are burned in a flame. Compounds eluting off the column are carried into a hydrogen fueled flame which excites specific elements in the molecules, and the excited elements (P,S, Halogens, Some Metals) emit light of specific characteristic wavelengths. The emitted light is filtered and detected by a photomultiplier tube. In particular, phosphorus emission is around 510-536nm and sulfur emission os at 394nm.
- Atomic Emission Detector (AED), a sample eluting from a column enters a chamber which is energized by microwaves that induce a plasma. The plasma causes the analyte sample to decompose and certain elements generate an atomic emission spectra. The atomic emission spectra is defracted by a diffraction gradient and detected by a series of photomultiplier tubes.
- Hall electrolytic conductivity detector (ElCD).
- Helium ionization detector (HID)
- Nitrogen–phosphorus detector (NPD), a form a thermionic detector where nitrogen and phosphorus alter the work function on a specially coated bead and a resulting current is measured.
- Infrared detector (IRD).
- Mass spectrometer (MS) – also called (GC-MS) highly effective and sensitive, even in a small quantity of sample.
- Photo-ionization detector (PID).
- Pulsed discharge ionization detector (PDD).
- Thermionic ionization detector (TID).
Some gas chromatographs are connected to a mass spectrometer which acts as the detector. The combination is known as GC-MS. Some GC-MS are connected to an NMR spectrometer which acts as a backup detector. This combination is known as GC-MS-NMR. Some GC-MS-NMR are connected to an infrared spectrophotometer which acts as a backup detector. This combination is known as GC-MS-NMR-IR. It must, however, be stressed this is very rare as most analyses needed can be concluded via purely GC-MS. (**Referenced on www.wikipedia.org.)
What is the Method?
The Method is the collection of conditions in which the GC operates for a given analysis. Method development is the process of determining what conditions are adequate and/or ideal for the analysis required.
Conditions which can be varied to accommodate a required analysis include inlet temperature, detector temperature, column temperature and temperature program, carrier gas, and carrier gas flow rates. The column's stationary phase, diameter and length, inlet type and flow rates, sample size and injection technique can also be varied. Depending on the detector(s) (see below) installed on the GC, there may be a number of detector conditions that can also be varied. Some GCs also include valves which can change the route of sample and carrier flow. The timing of the opening and closing of these valves can be important to method development.
What is a Qualitative Analysis?
Generally, chromatographic data is presented as a graph of detector response (y-axis) against retention time (x-axis), which is called a chromatogram. This provides a spectrum of peaks for a sample representing the analytes present in a sample eluting from the column at different times. Retention time can be used to identify analytes if the method conditions are constant. Also, the pattern of peaks will be constant for a sample under constant conditions and can identify complex mixtures of analytes. In most modern applications; however, the GC is connected to a mass spectrometer or similar detector that is capable of identifying the analytes represented by the peaks. (*Referenced on www.wikipedia.org.)
What is Quantitative Analysis?
The area under a peak is proportional to the amount of analyte present in the chromatogram. By calculating the area of the peak using the mathematical function of integration, the concentration of an analyte in the original sample can be determined. Concentration can be calculated using a calibration curve created by finding the response for a series of concentrations of analyte, or by determining the relative response factor of an analyte. The relative response factor is the expected ratio of an analyte to an internal standard (or external standard) and is calculated by finding the response of a known amount of analyte and a constant amount of internal standard (a chemical added to the sample at a constant concentration, with a distinct retention time to the analyte).
In most modern GC-MS systems, computer software is used to draw and integrate peaks, and match MS spectra to library spectra. (*Referenced on www.wikipedia.org.)
What are the diamondoid-based correlation methods?
Biomarker Technologies, Inc. has developed a variety of unique proprietary technologies based on nanometer-sized diamonds (diamondoids), which are trace components of petroleum. These diamondoid-based technologies have been used by virtually every major oil company including, Aramco, KOC, Shell, Chevron and Conoco, to list a few. For example, since 1995 we have worked with Petrobrás. Our innovative diamondoid technologies suggested a subsalt oil play prior to their major discoveries in the offshore Santos Basin of Brazil.
What is QEDA?
QEDA (Quantitative Extended Diamondoid Analysis): In 2003 we reported in the journal Science the discovery of numerous nanometer-sized diamonds (known as “Higher Diamondoids”) that occur in all liquid petroleum. QEDA is the fingerprint of higher diamondoids which is a genetic tracer for any liquid petroleum.
What is CSIA-D?
CSIA-D (Compound Specific Isotope Analysis of Diamondoids): The carbon isotopic signature of individual diamondoids is a fingerprint, which can be used in parallel with QEDA to determine the source of any oil, condensate, heavy oil or thermally-derived gas. These methods involve actually separating the diamondoids from the rest of the petroleum (Biomarker Technologies, Inc.) laboratory is the only one that can perform these separations and analyses.
The correlation of high-maturity fluids and many heavy oils cannot reliably be achieved without these unique proprietary Diamondoid-based techniques. Such correlations are the basis of improved basin models, leading to the generation of new exploration plays.
Technical Questions
What is CSIA-B?
CSIA-B (Compound Specific Isotope Analysis of Biomarkers): Biomarkers (many of them discovered by BTI geochemists1) are used by every major and most smaller oil companies to: (1) correlate black oils to their source, (2) to determine the maturity of the source rock at the time of oil generation, and (3) to determine the extent of post-emplacement processes such as biodegradation. As such they provide information essential to petroleum system basin modeling. Generally, for these purposes their quantitative fingerprints are used. However, the isotopic fingerprints of the individual biomarkers provide additional information, which for some oil can mean the difference between being able to assign a correct correlation or not.
Biomarker isotopes can be the only means to recognize oil derived from two or more different sources. Like CSIA-D, determining the isotopic signature of biomarkers requires their isolation from the rest of the petroleum. Again, based on decades of research on this subject, BTI has developed the proprietary technology necessary for this separation allowing it to be the only company to offer CSIA-B as a service.
1 Based on over 50 years of research and application experience at both Chevron and Stanford University, resulting in hundreds of publications in top scientific journals, the publication of the most important book written on petroleum geochemistry, “The Biomarker Guide”, and over 30 granted US and international patents, scientists at BTI are well positioned for this task. Professor J. M. Moldowan, the founder of BTI, received the Treib’s medal in 2011, the highest award in geochemistry, honoring his career of achievements in petroleum geochemistry.
Questions about our company
What are Diamondoids?
Diamondoids are the most stable molecules in petroleum and their concentrations increase as oil begins to crack, These diamondoids continue to increase as further cracking occurs, even to dry gas. The presence of relatively-high concentrations of both diamondoids and biomarkers in the same oil indicates that the oil is a mixture derived from sources at very different levels of maturity. It is difficult, or impossible, to recognize such mixtures by any other means. And recognizing these mixtures and identifying the different sources using biomarkers, QEDA, and CSIA-D are key to developing new and improved basin models generating new exploration plays, which can include deep light liquids and gas.

